Quality you cannot verify
Cleaning processes lack transparency and results are hard to verify; fresh areas build up dirt and risk secondary contamination.
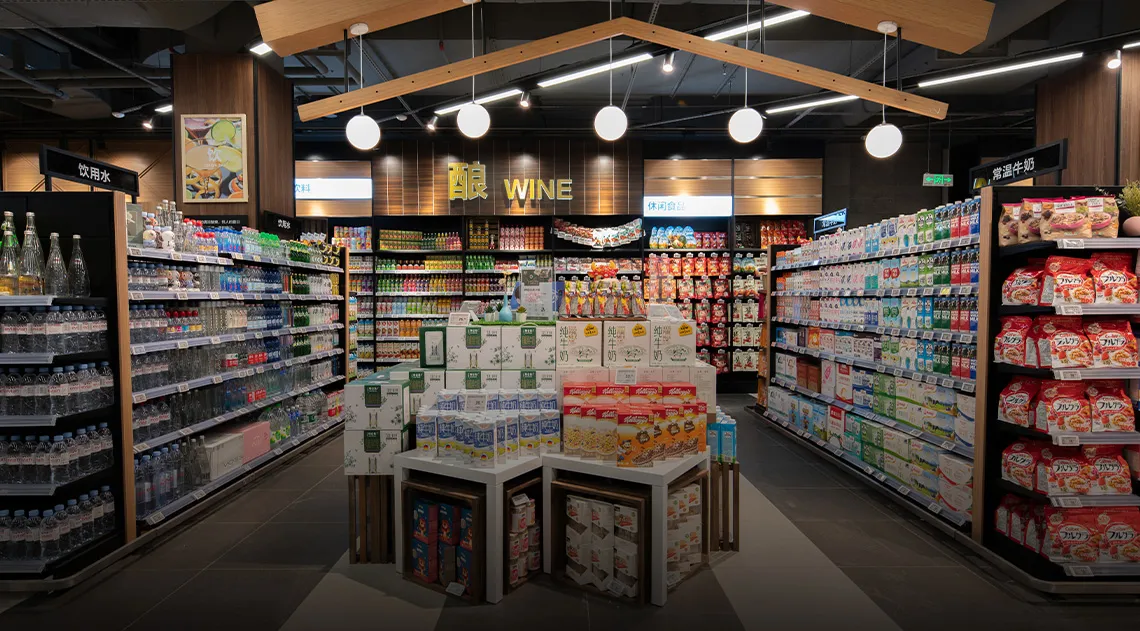
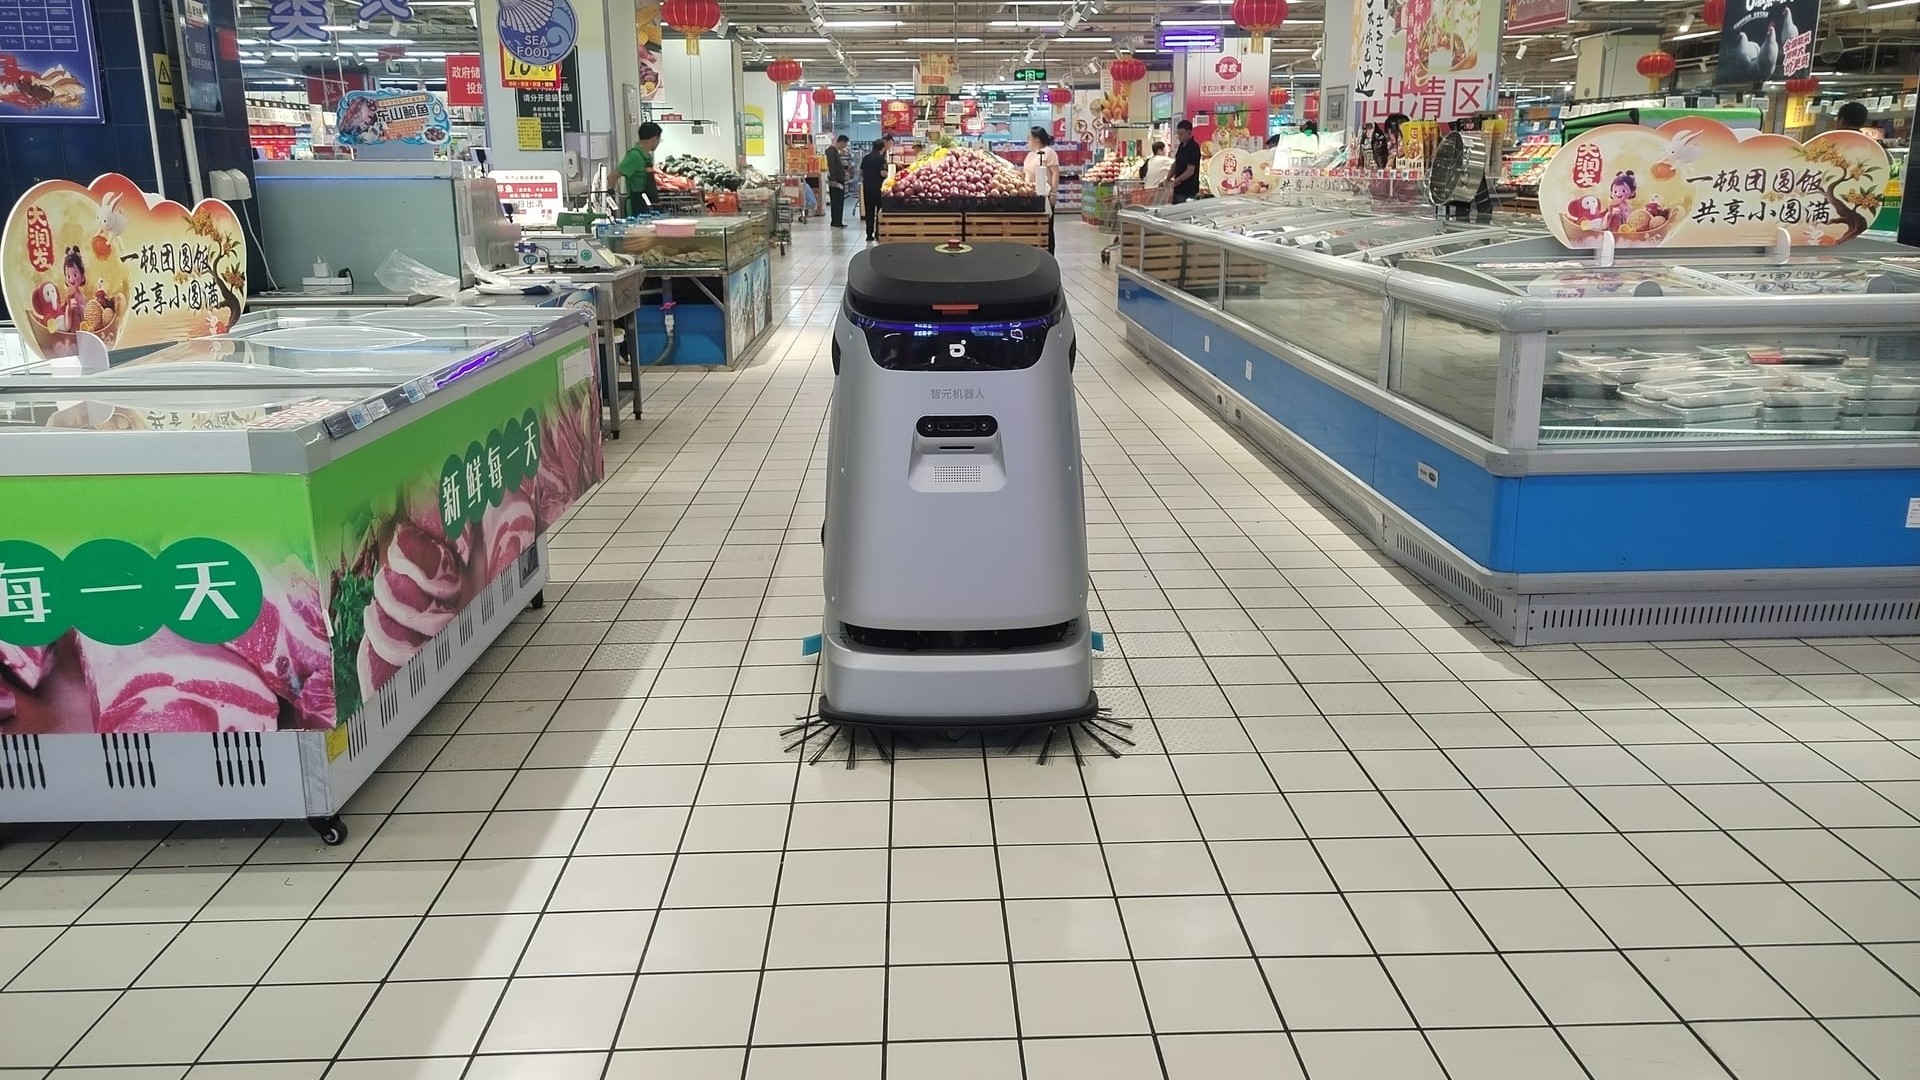
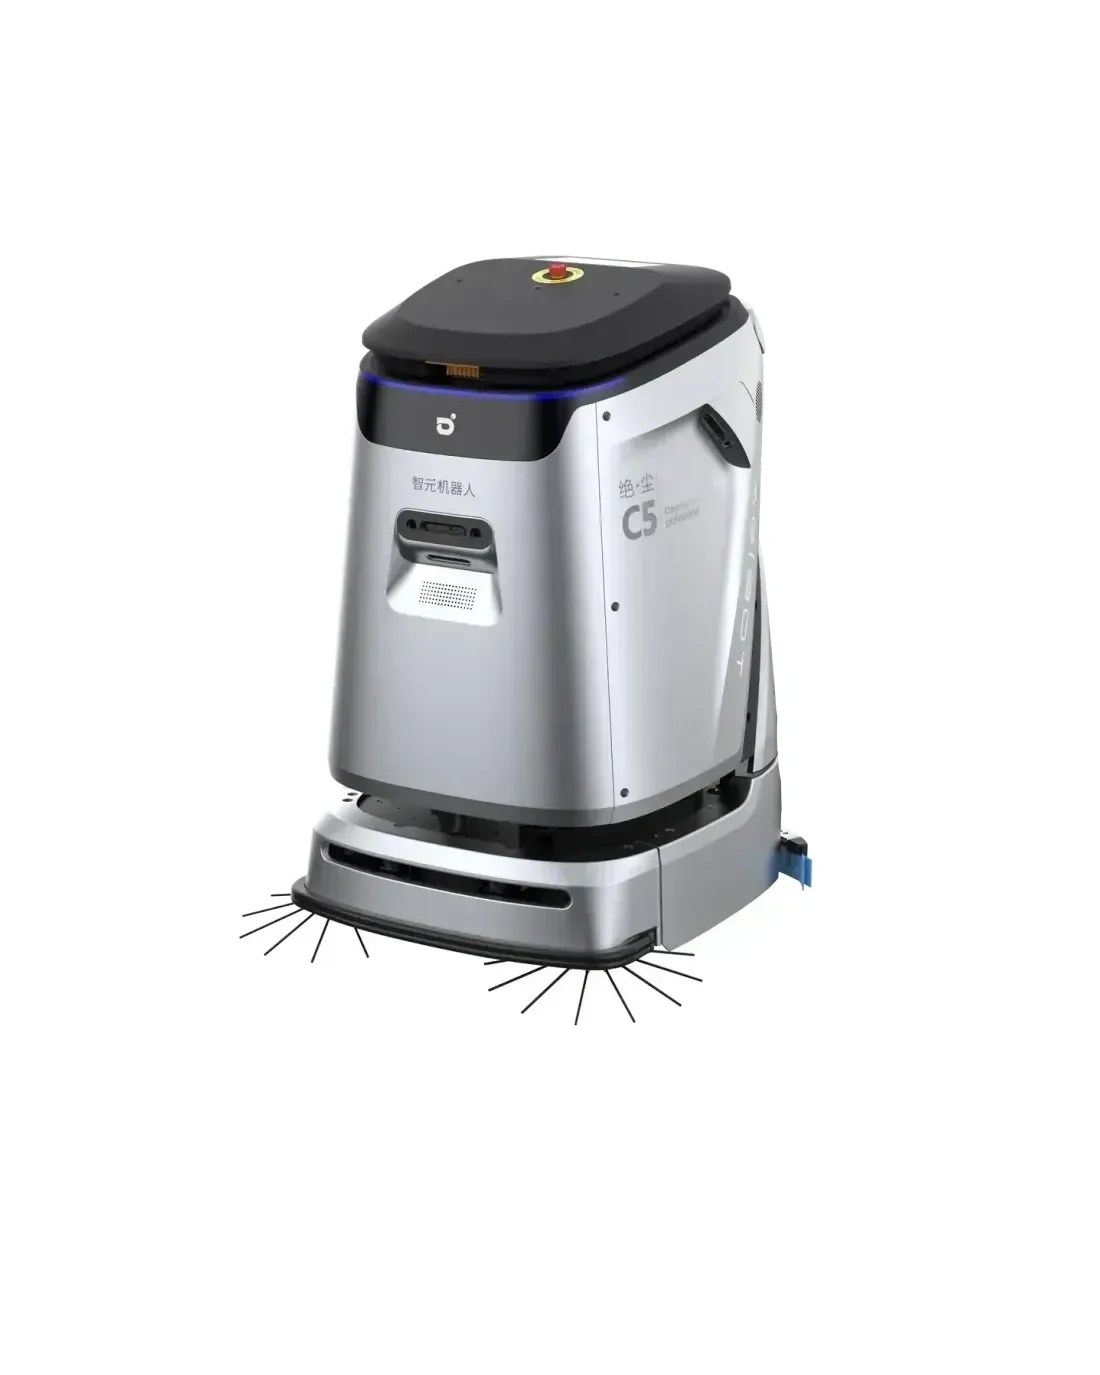
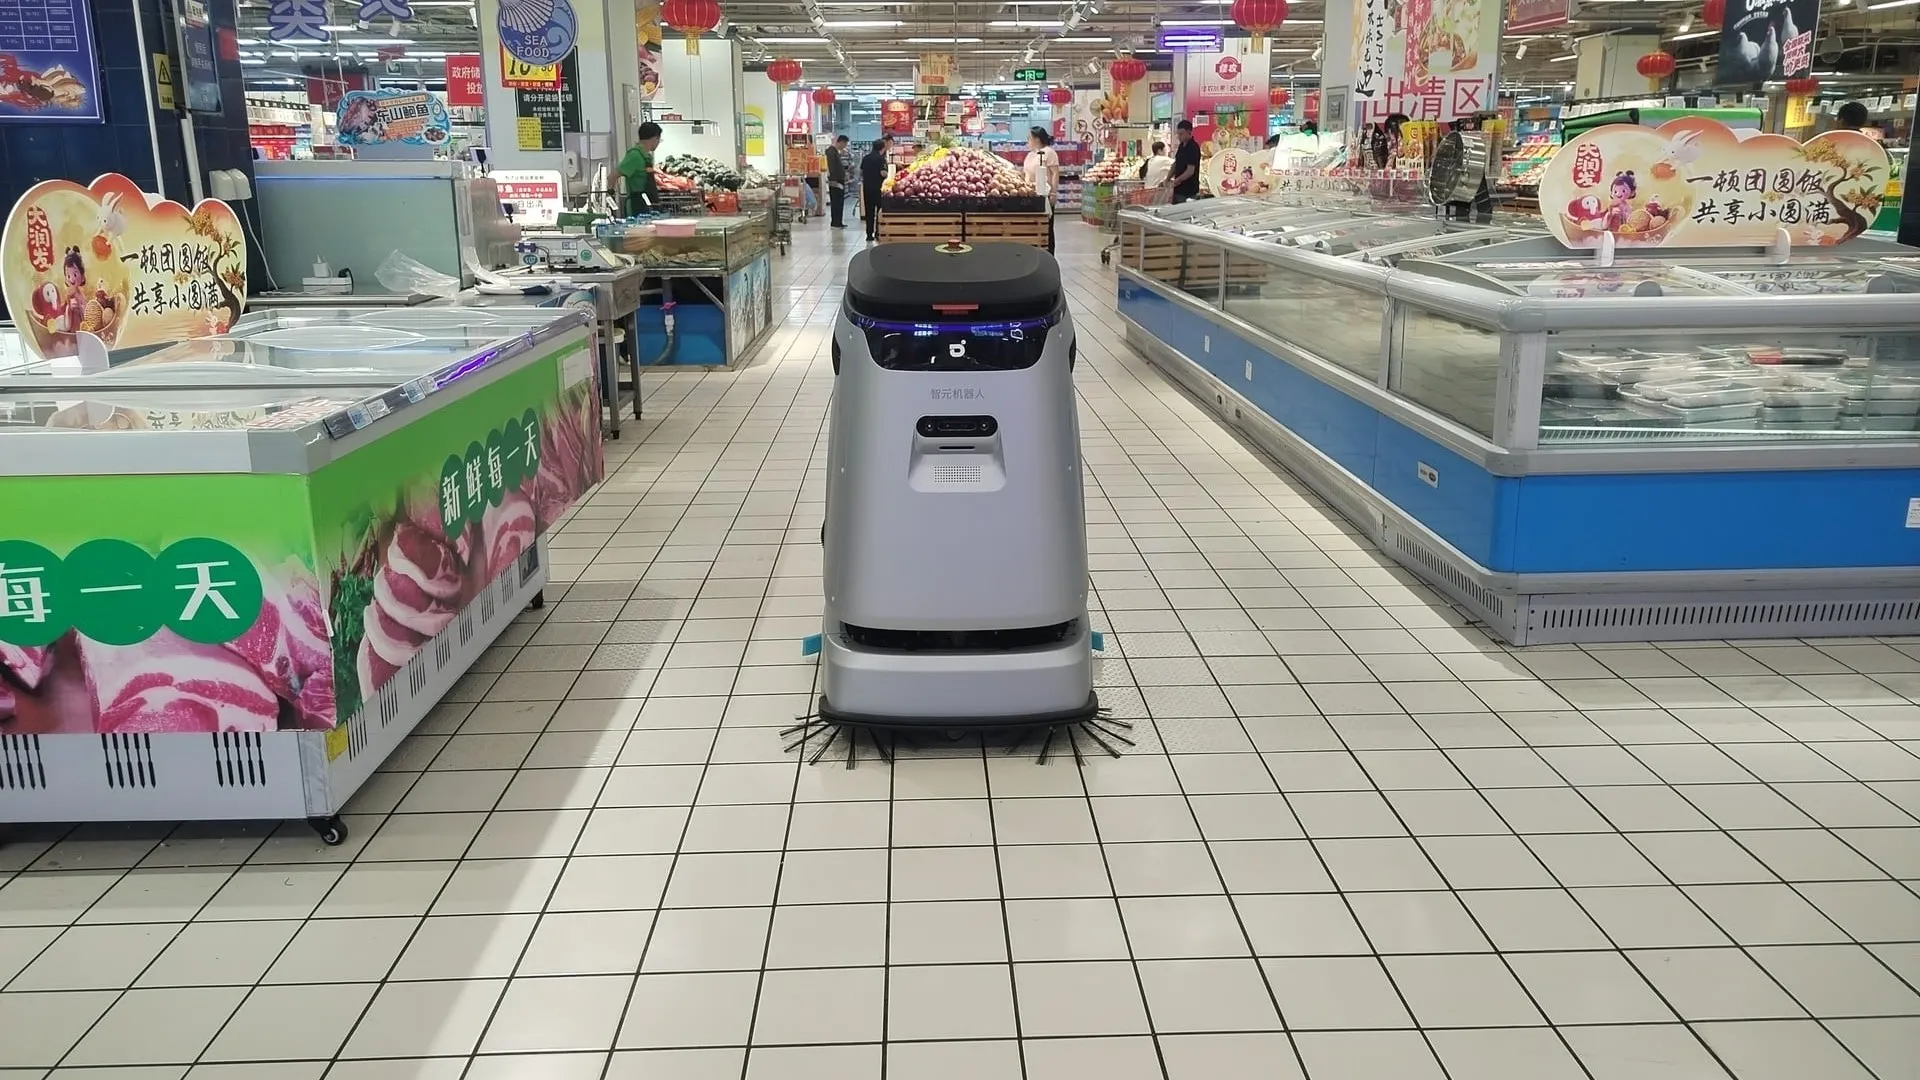
Fresh produce, grains and oil areas produce dirt that spreads fast, and cleaning cannot interrupt trading. C5 finishes a full pass before opening and tops up after the peaks.
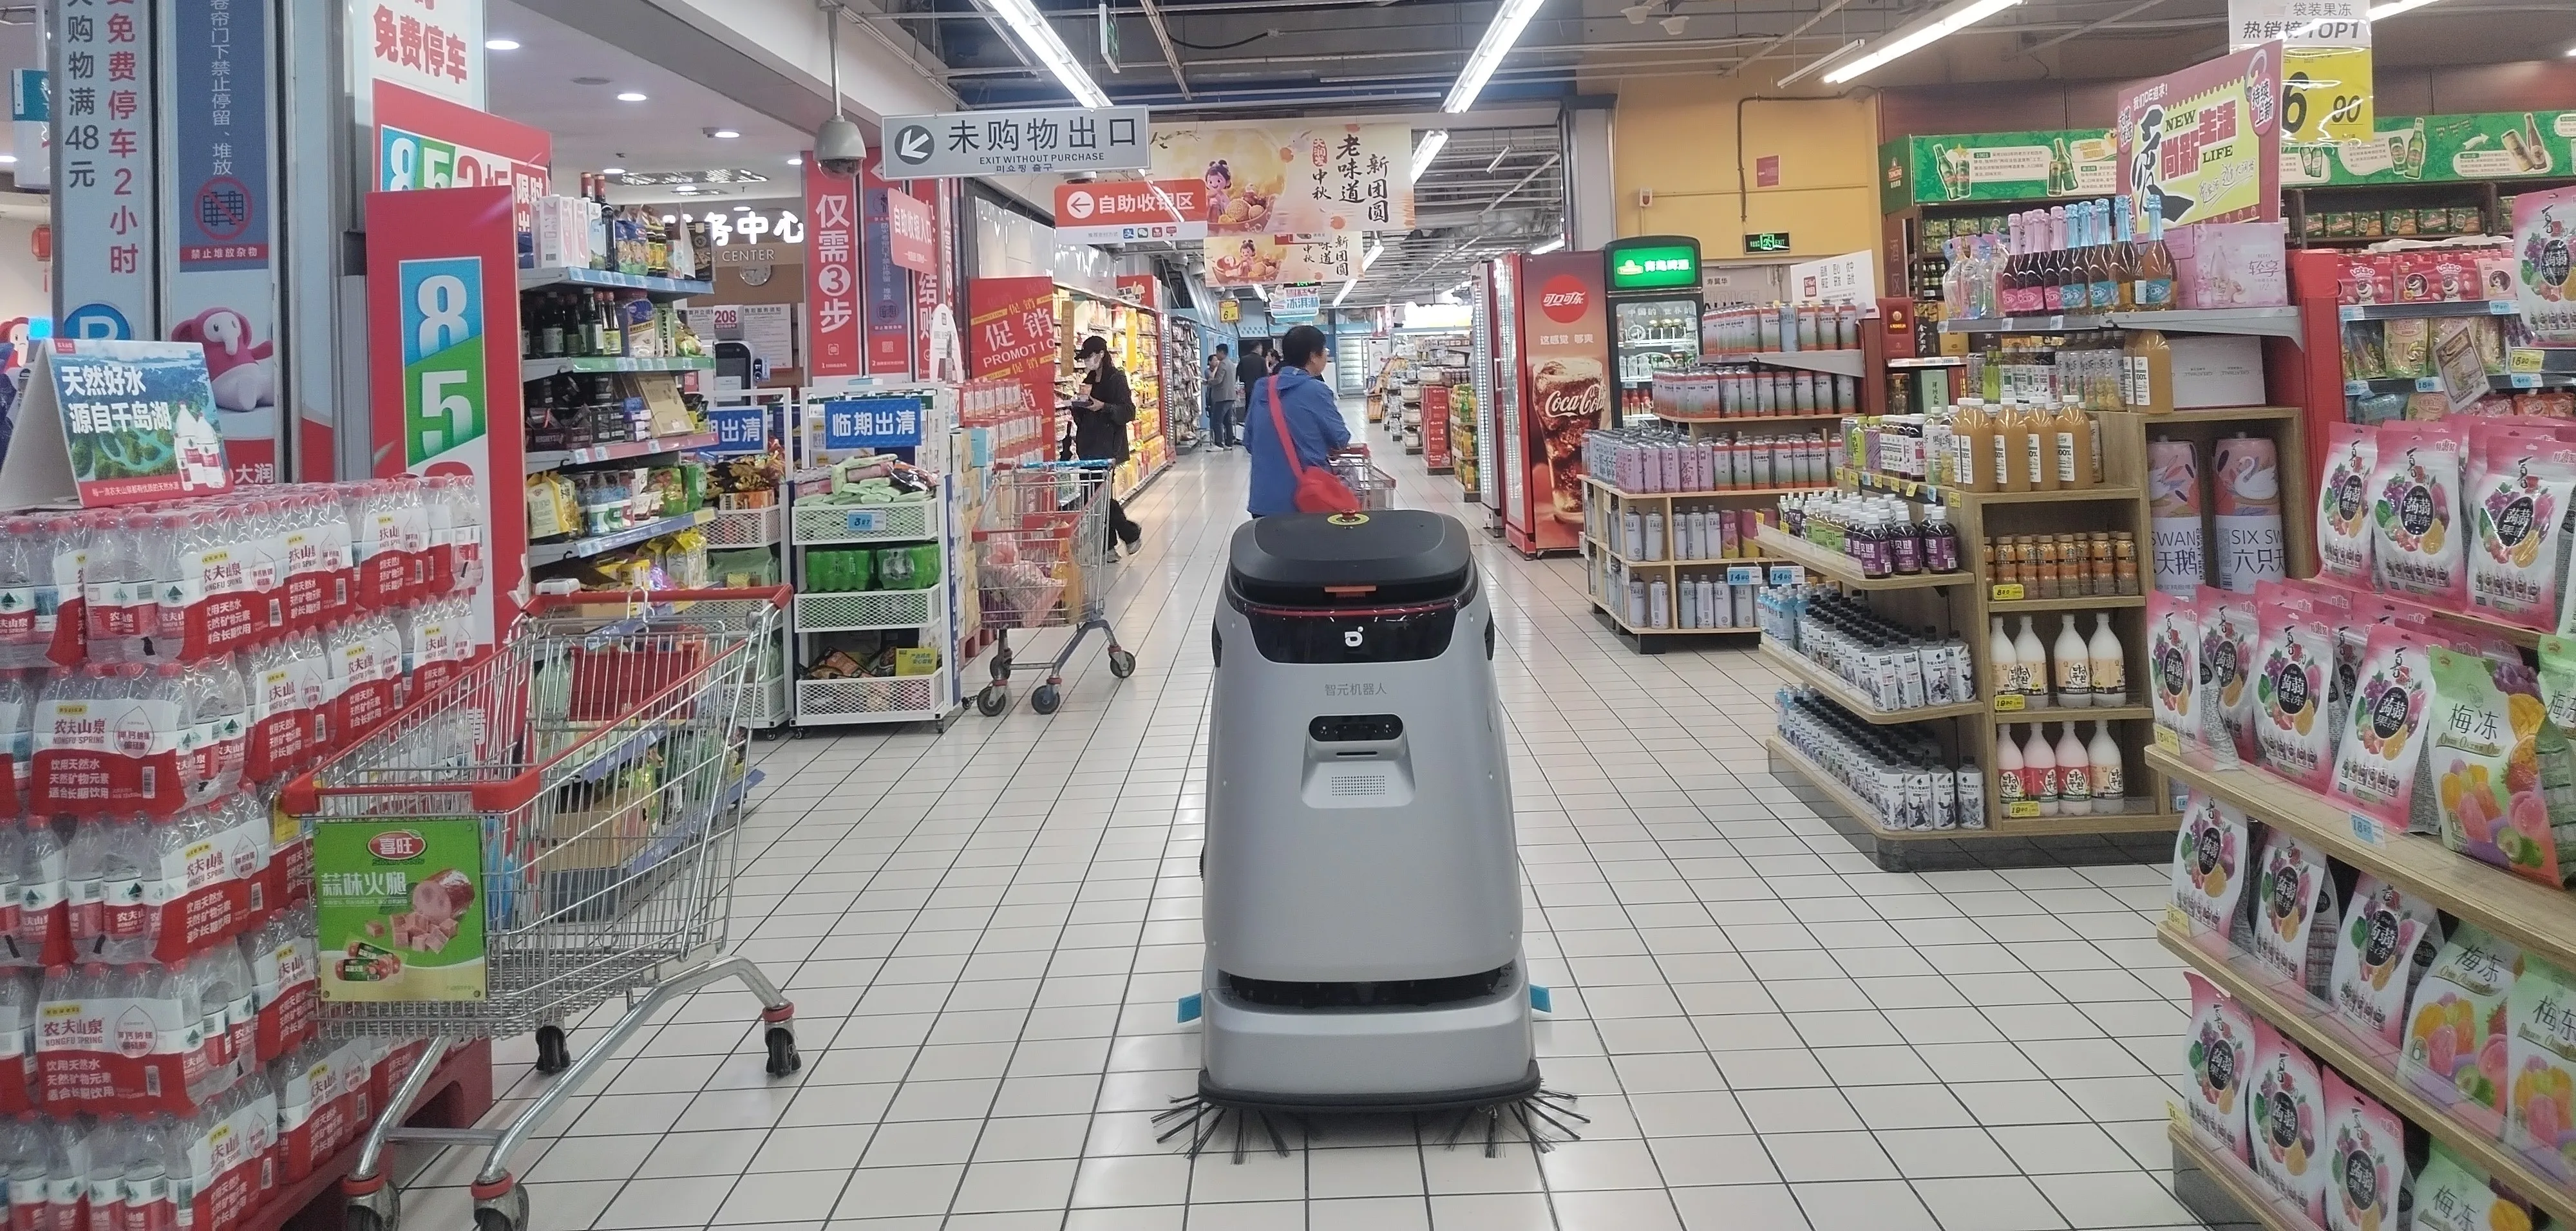
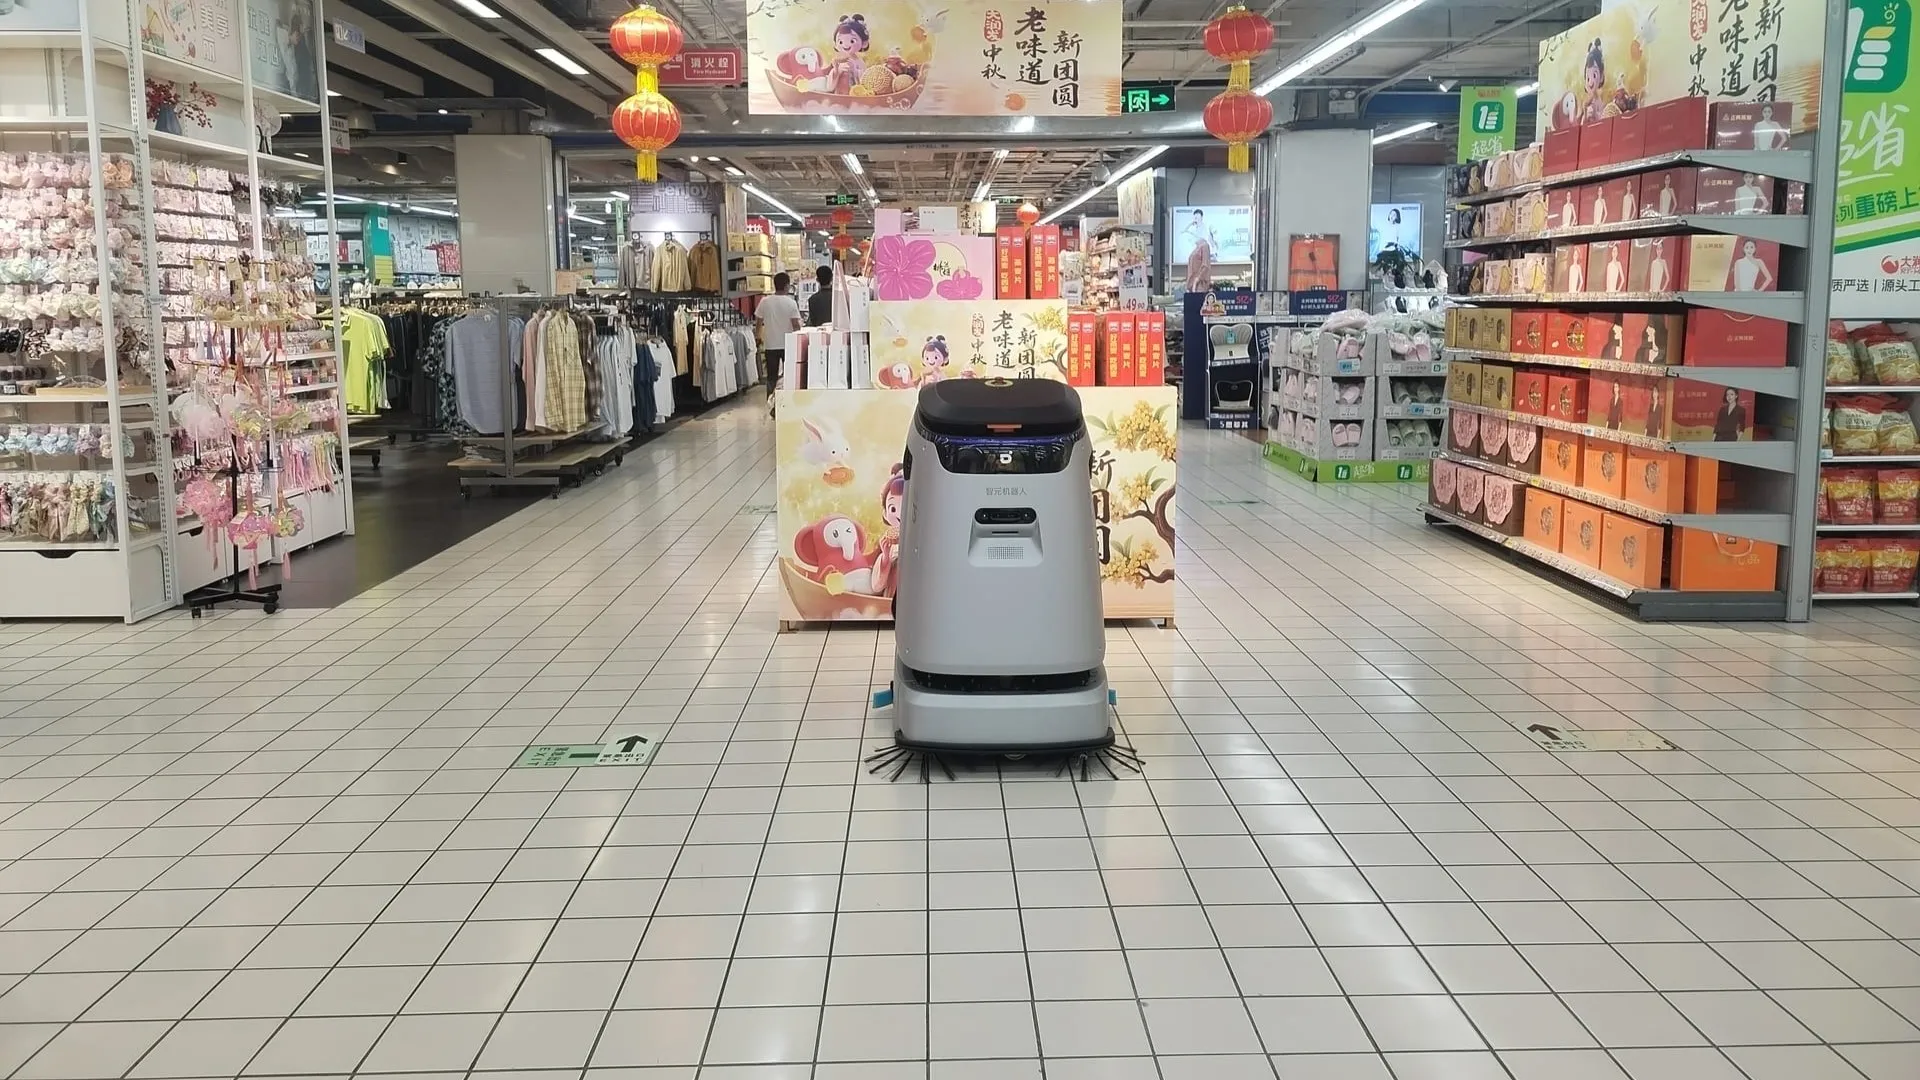
Oil, dust, footfall and the hours you can clean decide the plan before a model does.
Cleaning processes lack transparency and results are hard to verify; fresh areas build up dirt and risk secondary contamination.
Cleaning operations carry safety risks, while an ageing workforce adds health risk and management complexity.
A heavy manual cleaning workload pushes up overall cost, and high turnover drives recruitment and management spend.
The machines, the zones they cover and the records that prove what happened.
Three choices that change how the site runs.
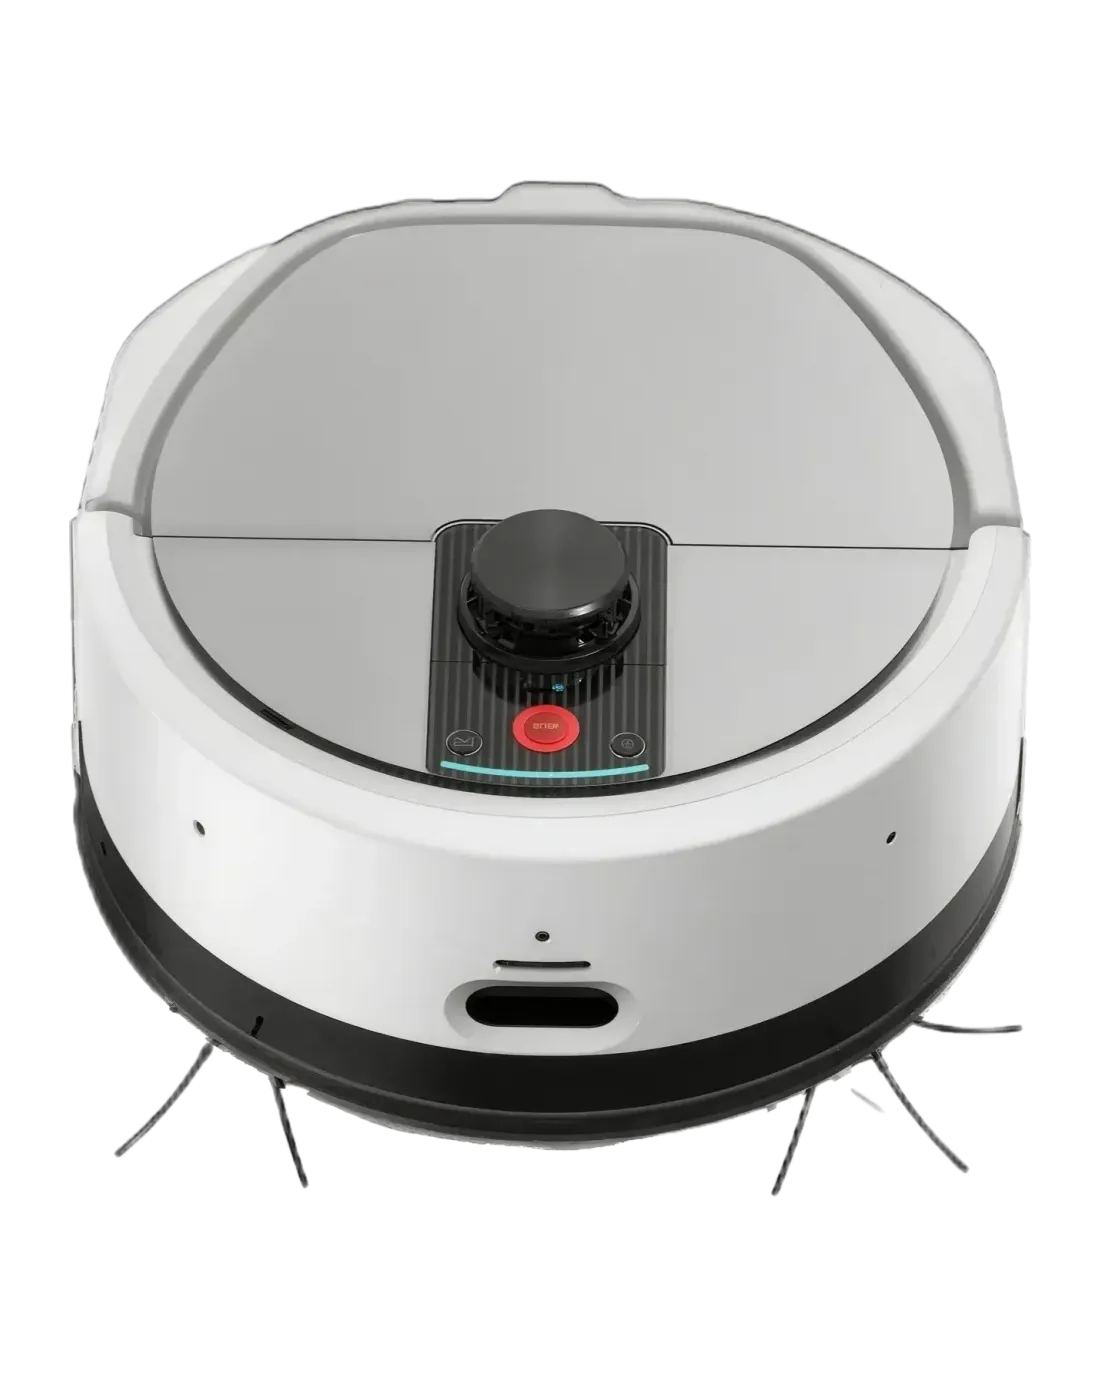
C5 handles oil stains while efficiently collecting solid debris.
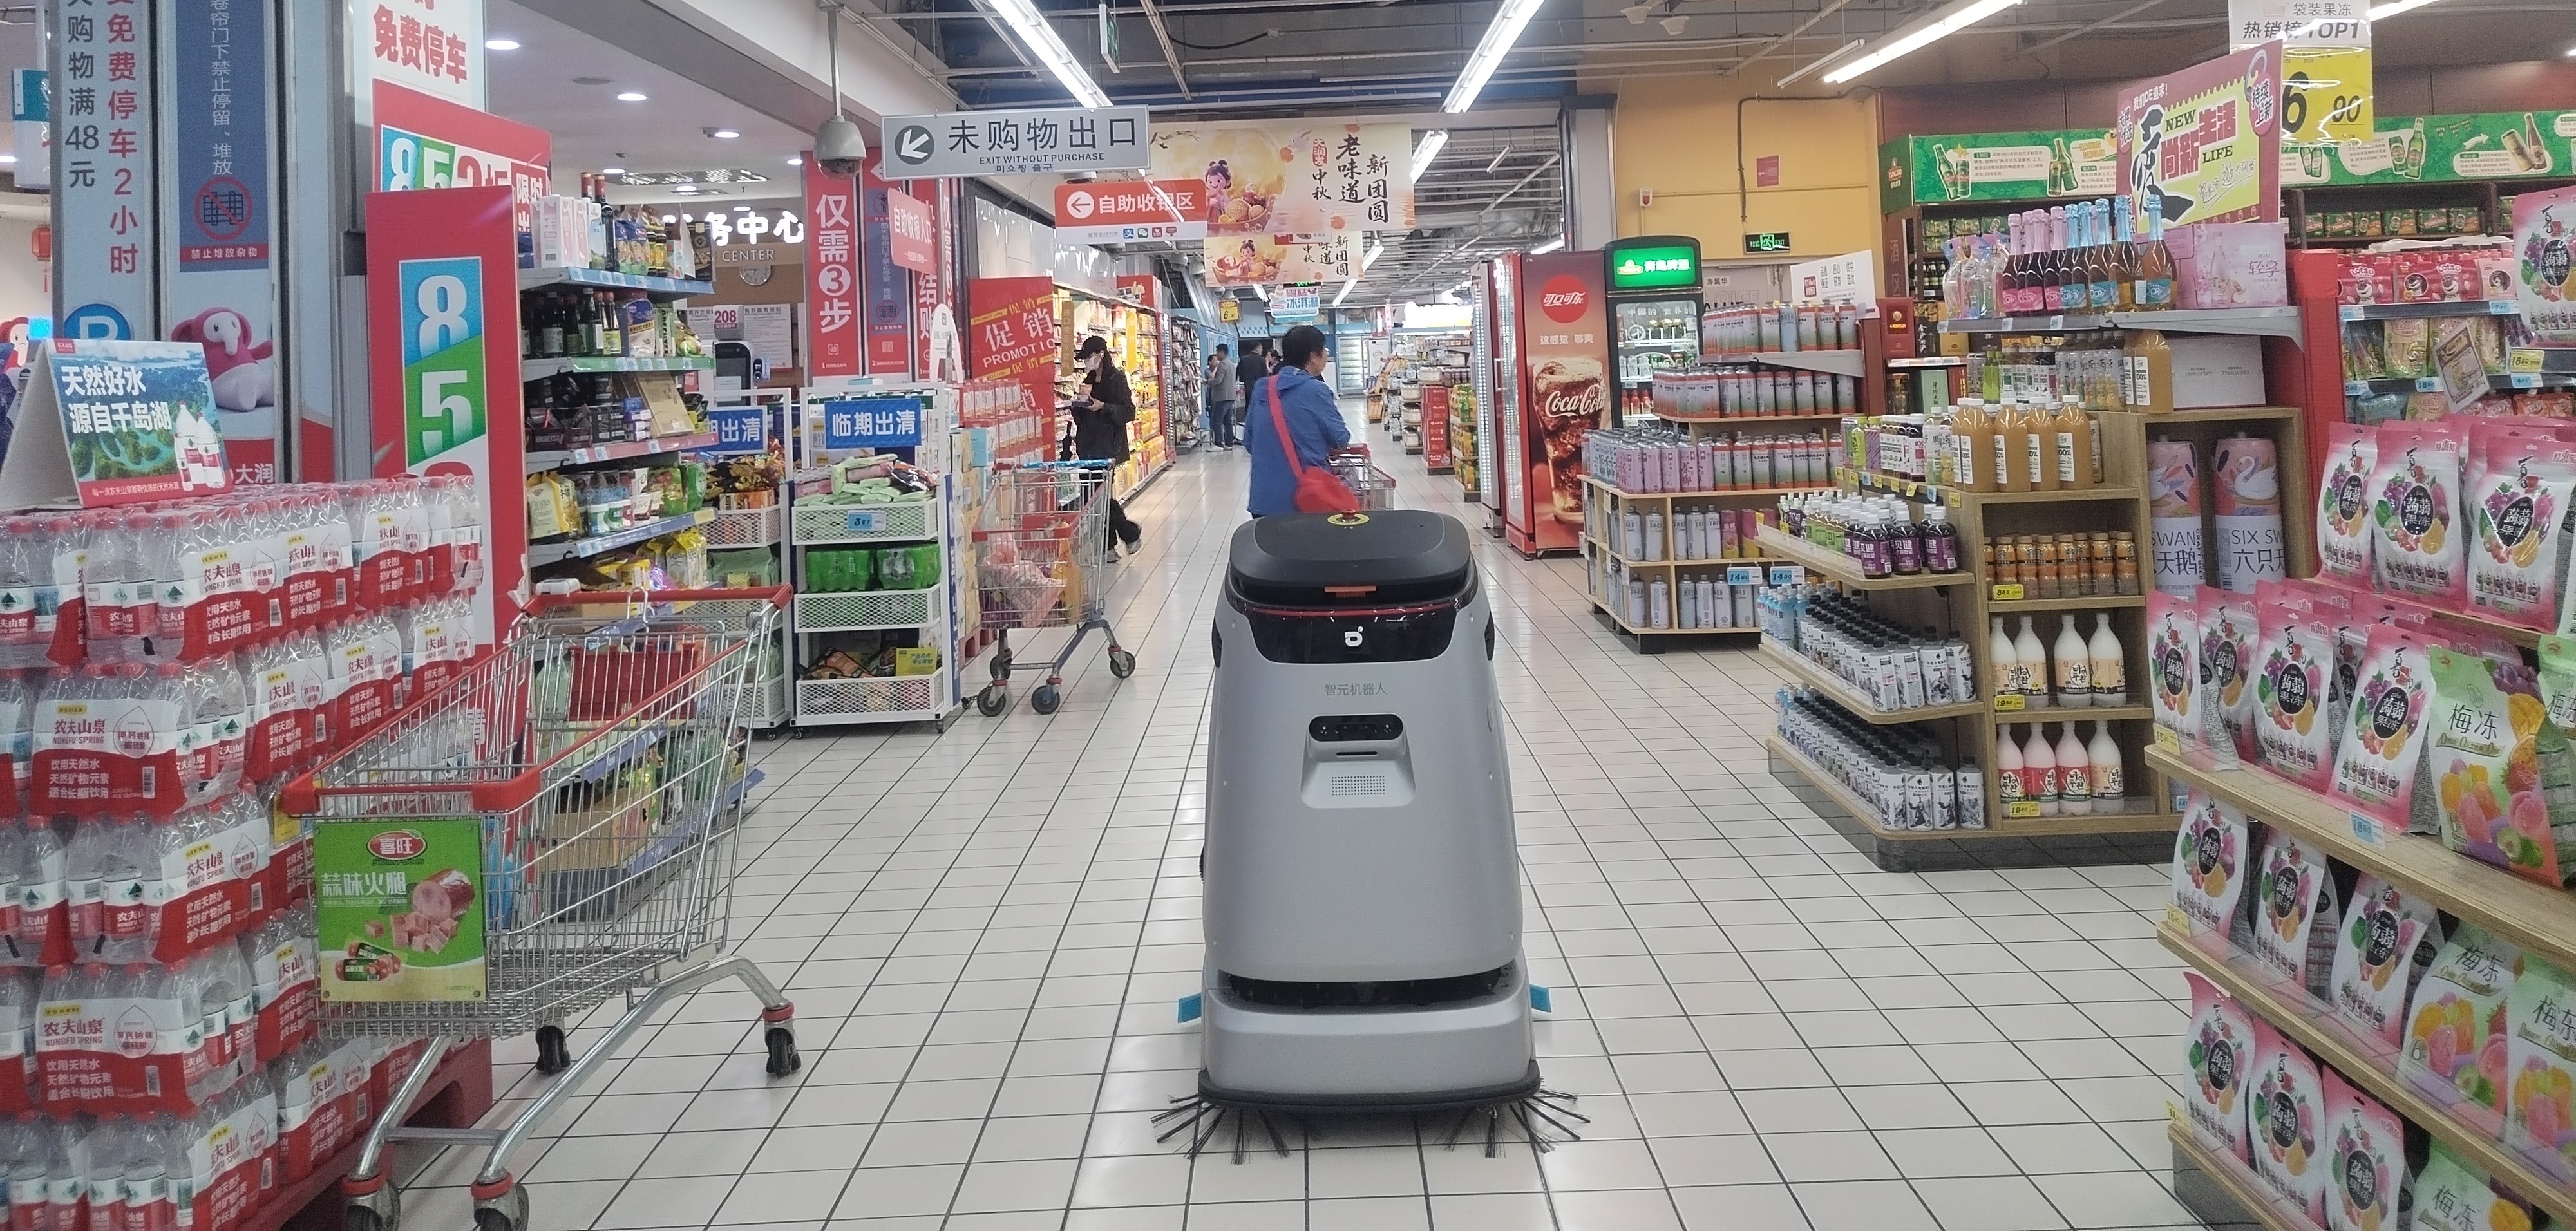
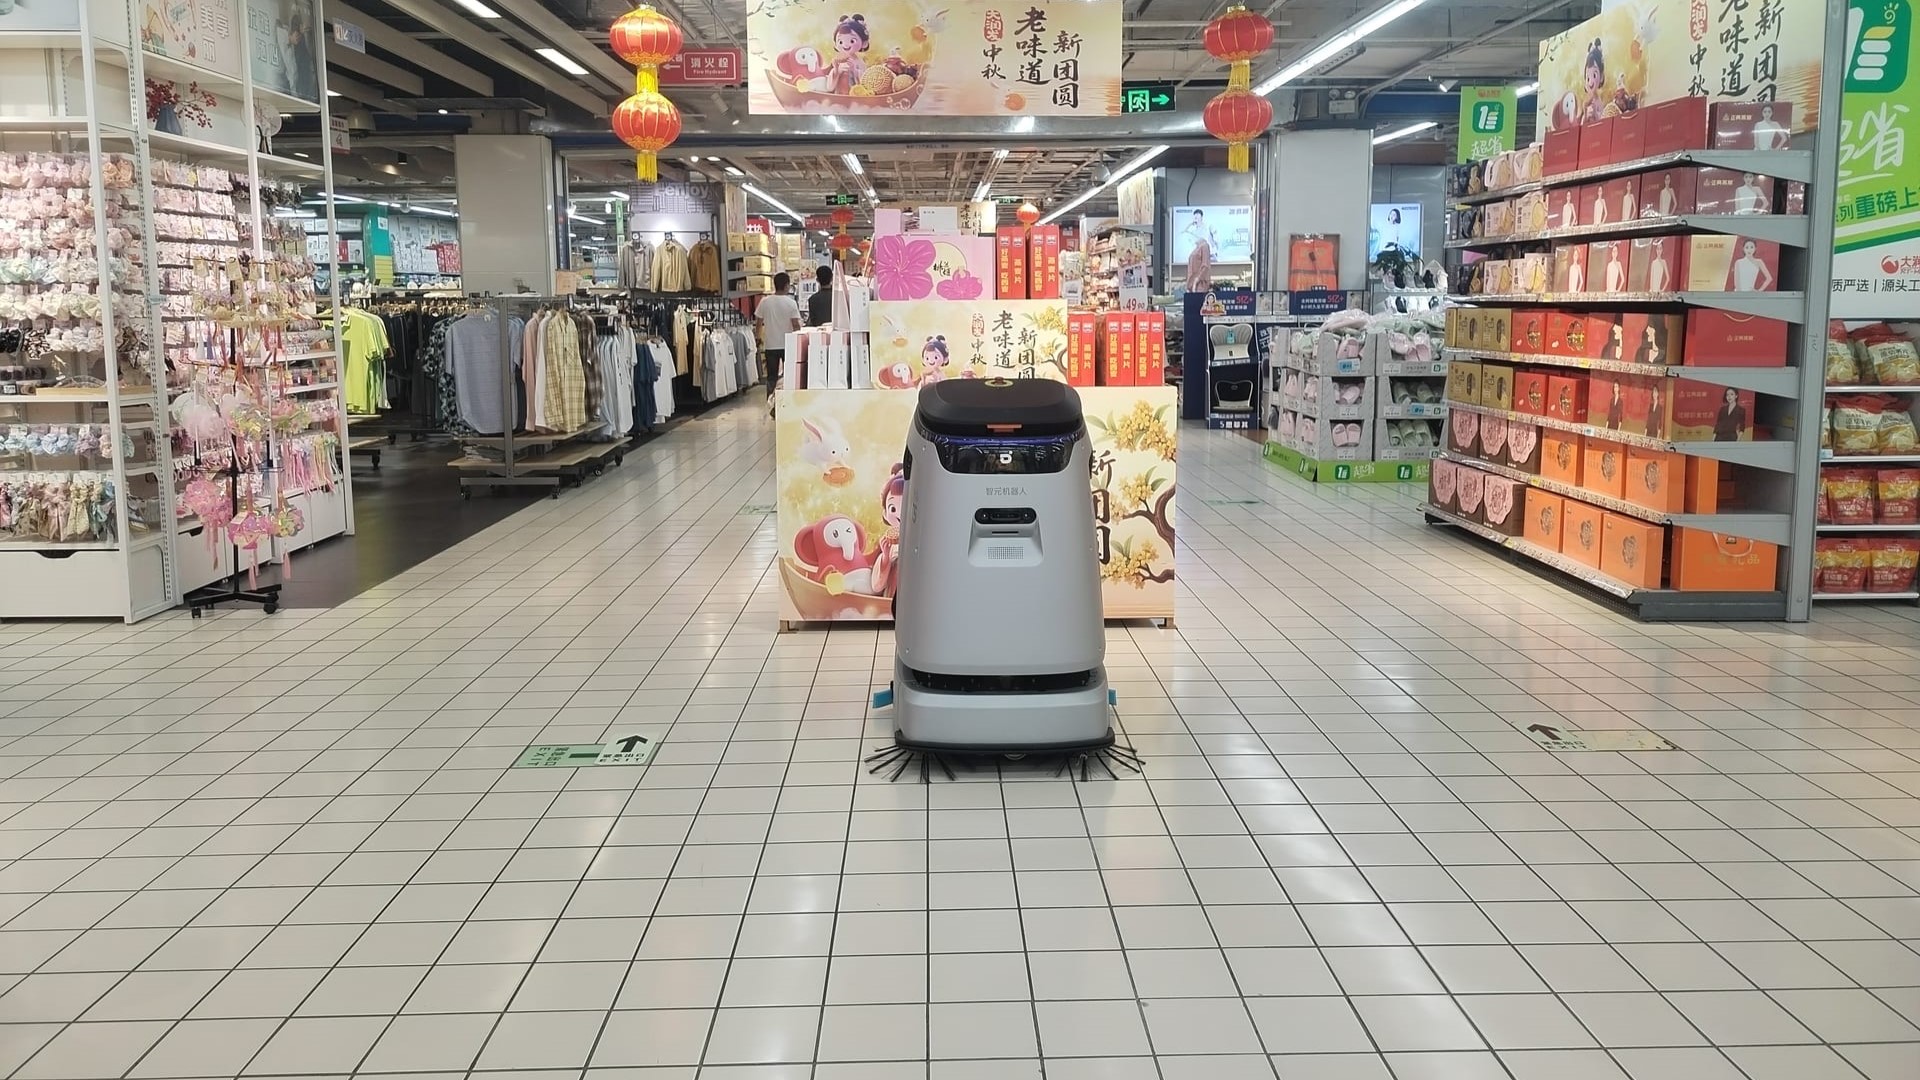
Deep-learning algorithms avoid shelving and goods while keeping close to the edge.
Work avoids peak customer traffic, a full pass completes before opening, and high-sensitivity areas get extra attention.
Zone by zone, in the order the site actually runs them.
| Zone | Cleaning mode | Frequency | Unit |
|---|---|---|---|
| Fresh produce area | Continuous scrubbing | 2 full passes/day plus daytime top-ups | C5 |
| Grains and oil area | Scrubbing with cleaning agent | 1 pass before opening, 1 after peak | C5 |
| Other trading areas | Full-coverage scrubbing | 2 passes/day | C5 |
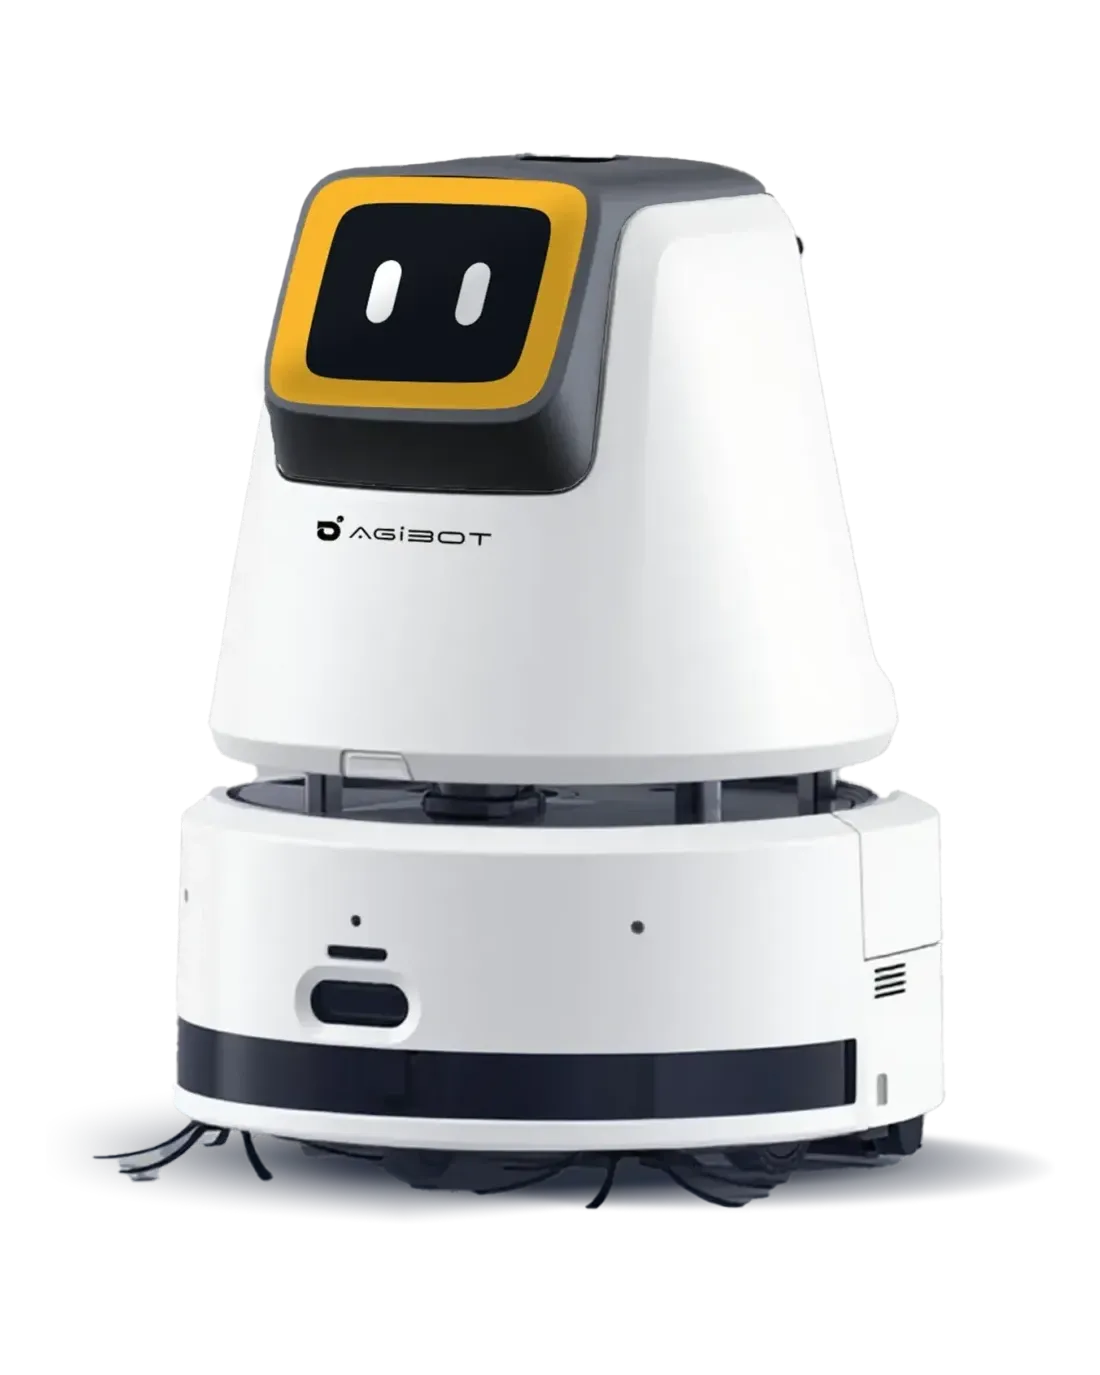
| Back office and small stores | Wet mopping | On demand | C2 |
The same work, before and after, on the metrics that matter to this site.
| Metric | Manual cleaning | With BRAWN robots |
|---|---|---|
| Manual passes (fresh produce area) | Several manual passes per day | Fewer manual passes needed |
| Coverage | Depends on staff judgement | Full pass before opening, 2 passes/day |
| Secondary contamination | Fresh areas soil again quickly | Extra scrubs after peaks |
| Process control | Results cannot be verified | Data-driven, traceable results |
Comparison figures are typical-scenario estimates from the solution handbook, not client measurements.
From the first survey to a running fleet: the same four steps on every project.
A walk-through of areas, surfaces, obstacles, lift and access-control conditions, plus the plumbing available for a docking station.
Model mix, zone plan, cleaning frequency and consumable estimate. A labour comparison is included only when the customer supplies a reliable baseline; the current answer set has no verified before-and-after labour case.
Staging plan, charging and docking positions, network and lift integration scope, and a training schedule for the operating team.
The cloud platform reports equipment status and faults, and self-check covers sensors, motors and the main controller. Partners receive remote technical support for genuine product faults; site-network, water or drainage problems remain site responsibilities.
We can still run a sizing estimate for your site, and arrange a visit to a comparable project where the client agrees.
The next scenarios in the line.